S&P 500 Price Returns during Presidential Elections Years
It’s Super Tuesday!
Heading into the year, all eyes were on the upcoming Presidential Election. Impeachment, trade disputes, and Brexit were all seemingly behind us and the only unknown on the horizon was the election. Then along came Corona… the Virus. Ahem.
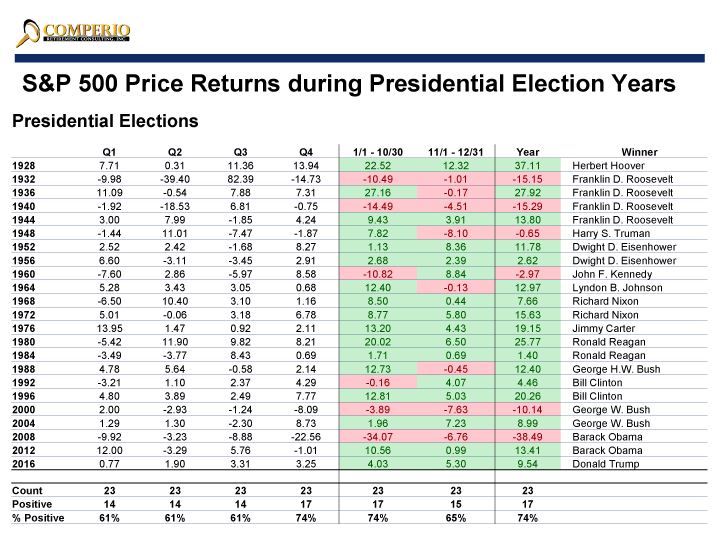
But here’s what we were thinking about before the pandemic. Below is a chart showing the price return (return excluding dividends) of the S&P 500 Index during each Presidential Election Year since 1928. On average, the S&P 500 delivered positive returns in 74% of the time during an election year, compared with 66% for all years. So, we can assume the market generally favors election cycles. But let’s break down the 74% a little further.
First, notice the chart has each calendar year, each quarter’s return during the calendar year, and two columns showing the returns before the November general election and the returns for the final two months of each year. To make it interesting, we added the eventual winner.
The last negative return was in 2008 when Barack Obama was elected – in the aftermath of the global financial crisis. In 2000, the market was down 10% when George W was elected. Much like Obama, the market under W suffered from the beginnings of the tech-wreck. Prior to that, we have to go back to 1960 when JFK was elected. But notice that the market rallied nearly 9% in the final two months of the year to finish the year down a modest 3%. Under Truman, the exact opposite occurred – with the market dropping 8% in the final two months as the post-WWII recession loomed. Alas, we’ve now made it to the Great Depression.
As we can see, the market generally favors Presidential Election Years. Generally. The noted exceptions were the Global Financial Crisis, the Dot.com bust, a post-war recession, and the Great Depression. Will 2020 fit the norm or will a global pandemic lead to another exception? Stay tuned.

 Comperio Retirement Consulting has been named one of the largest 100 Investment Consultants in the United States according to Pension & Investments (P&I) for the past 8 years